GGPLOT - position_jitter
Adding random noise to a plot can sometimes make it easier to read and then convert them with ggplotly.
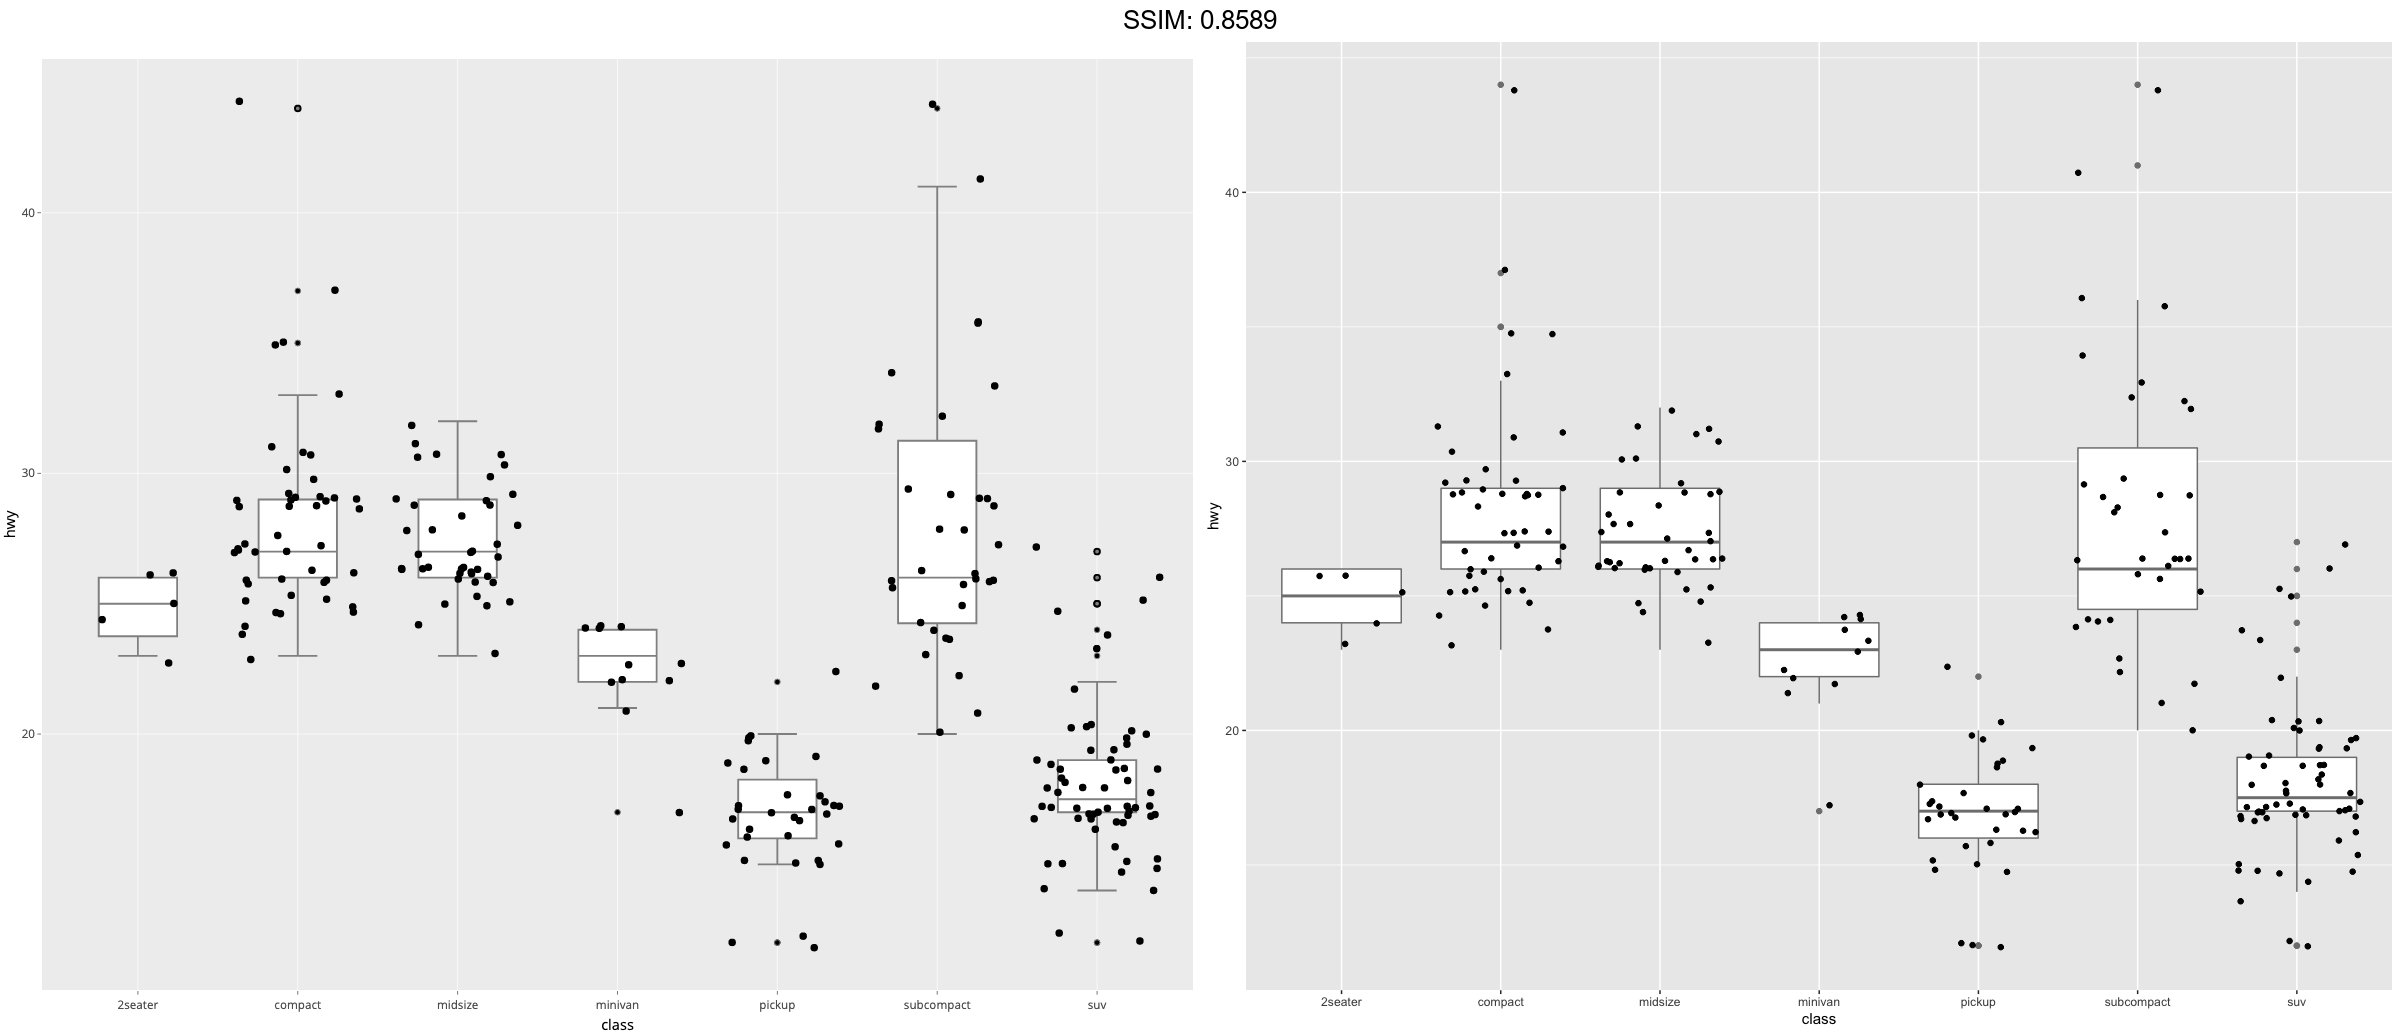
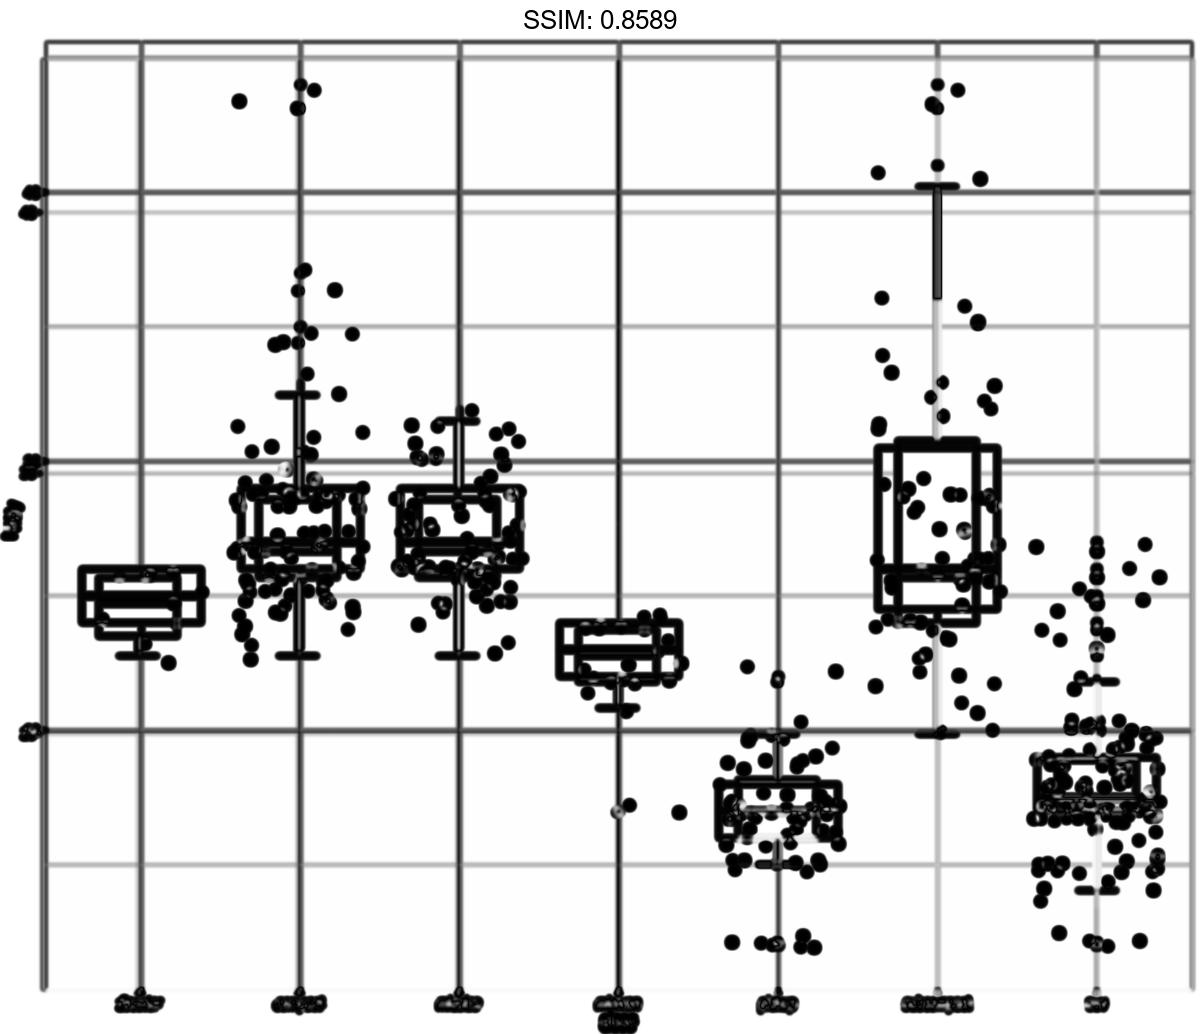
p <-
 ggplot(mpg, aes(class, hwy)) +
  geom_boxplot(colour = "grey50") +
  geom_jitter()
plotly::ggplotly(p)

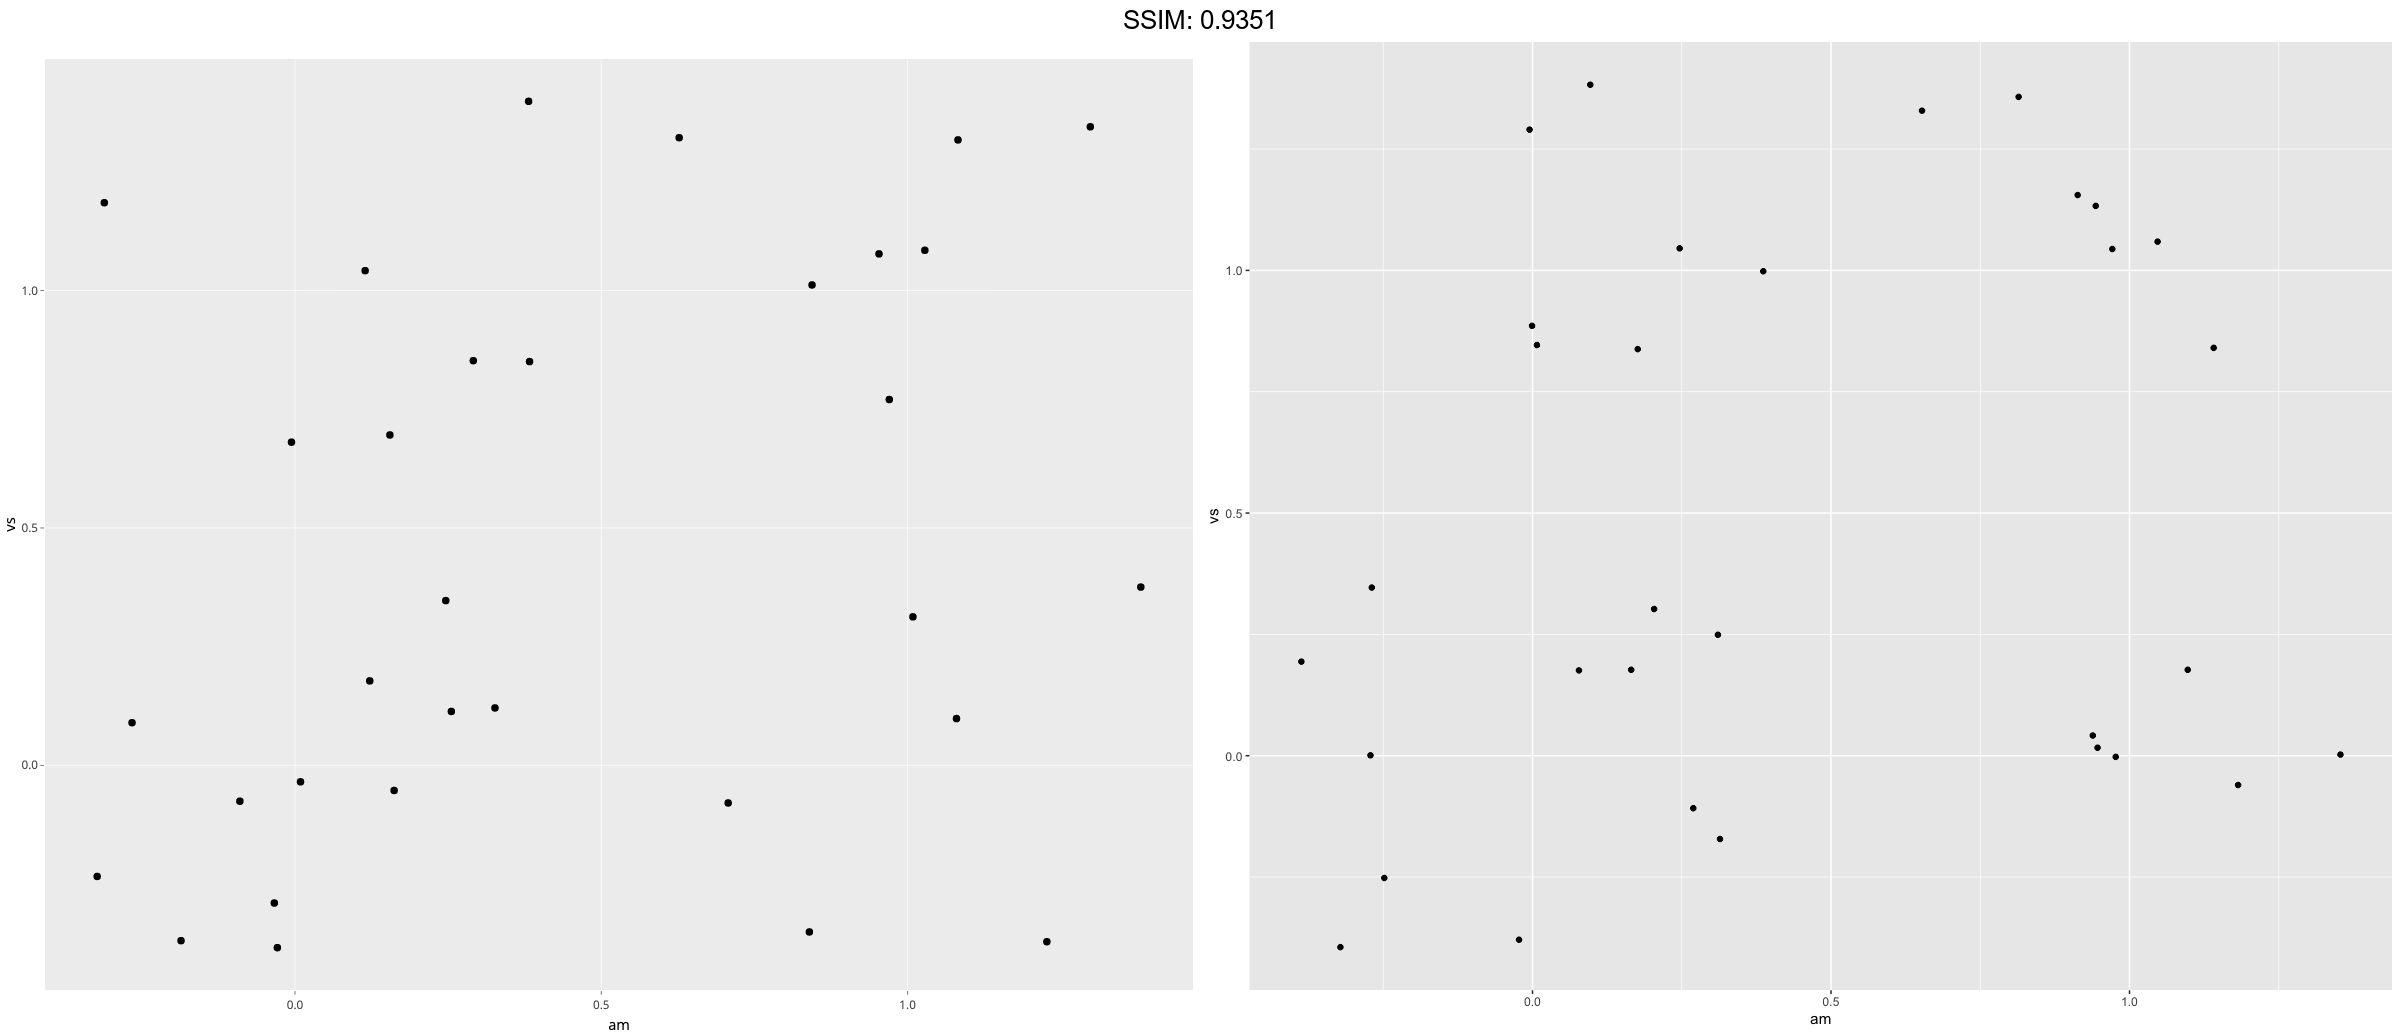
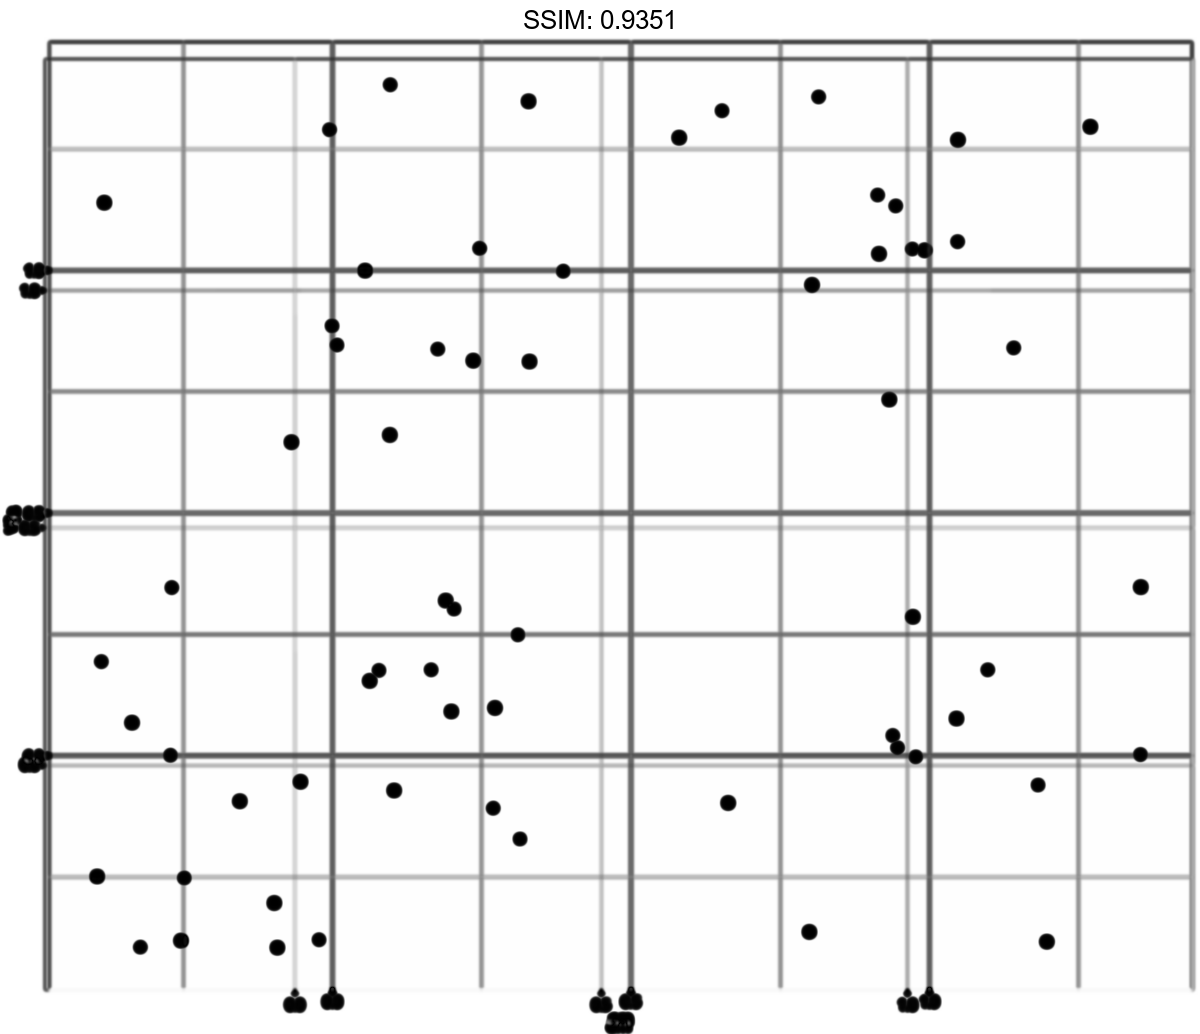
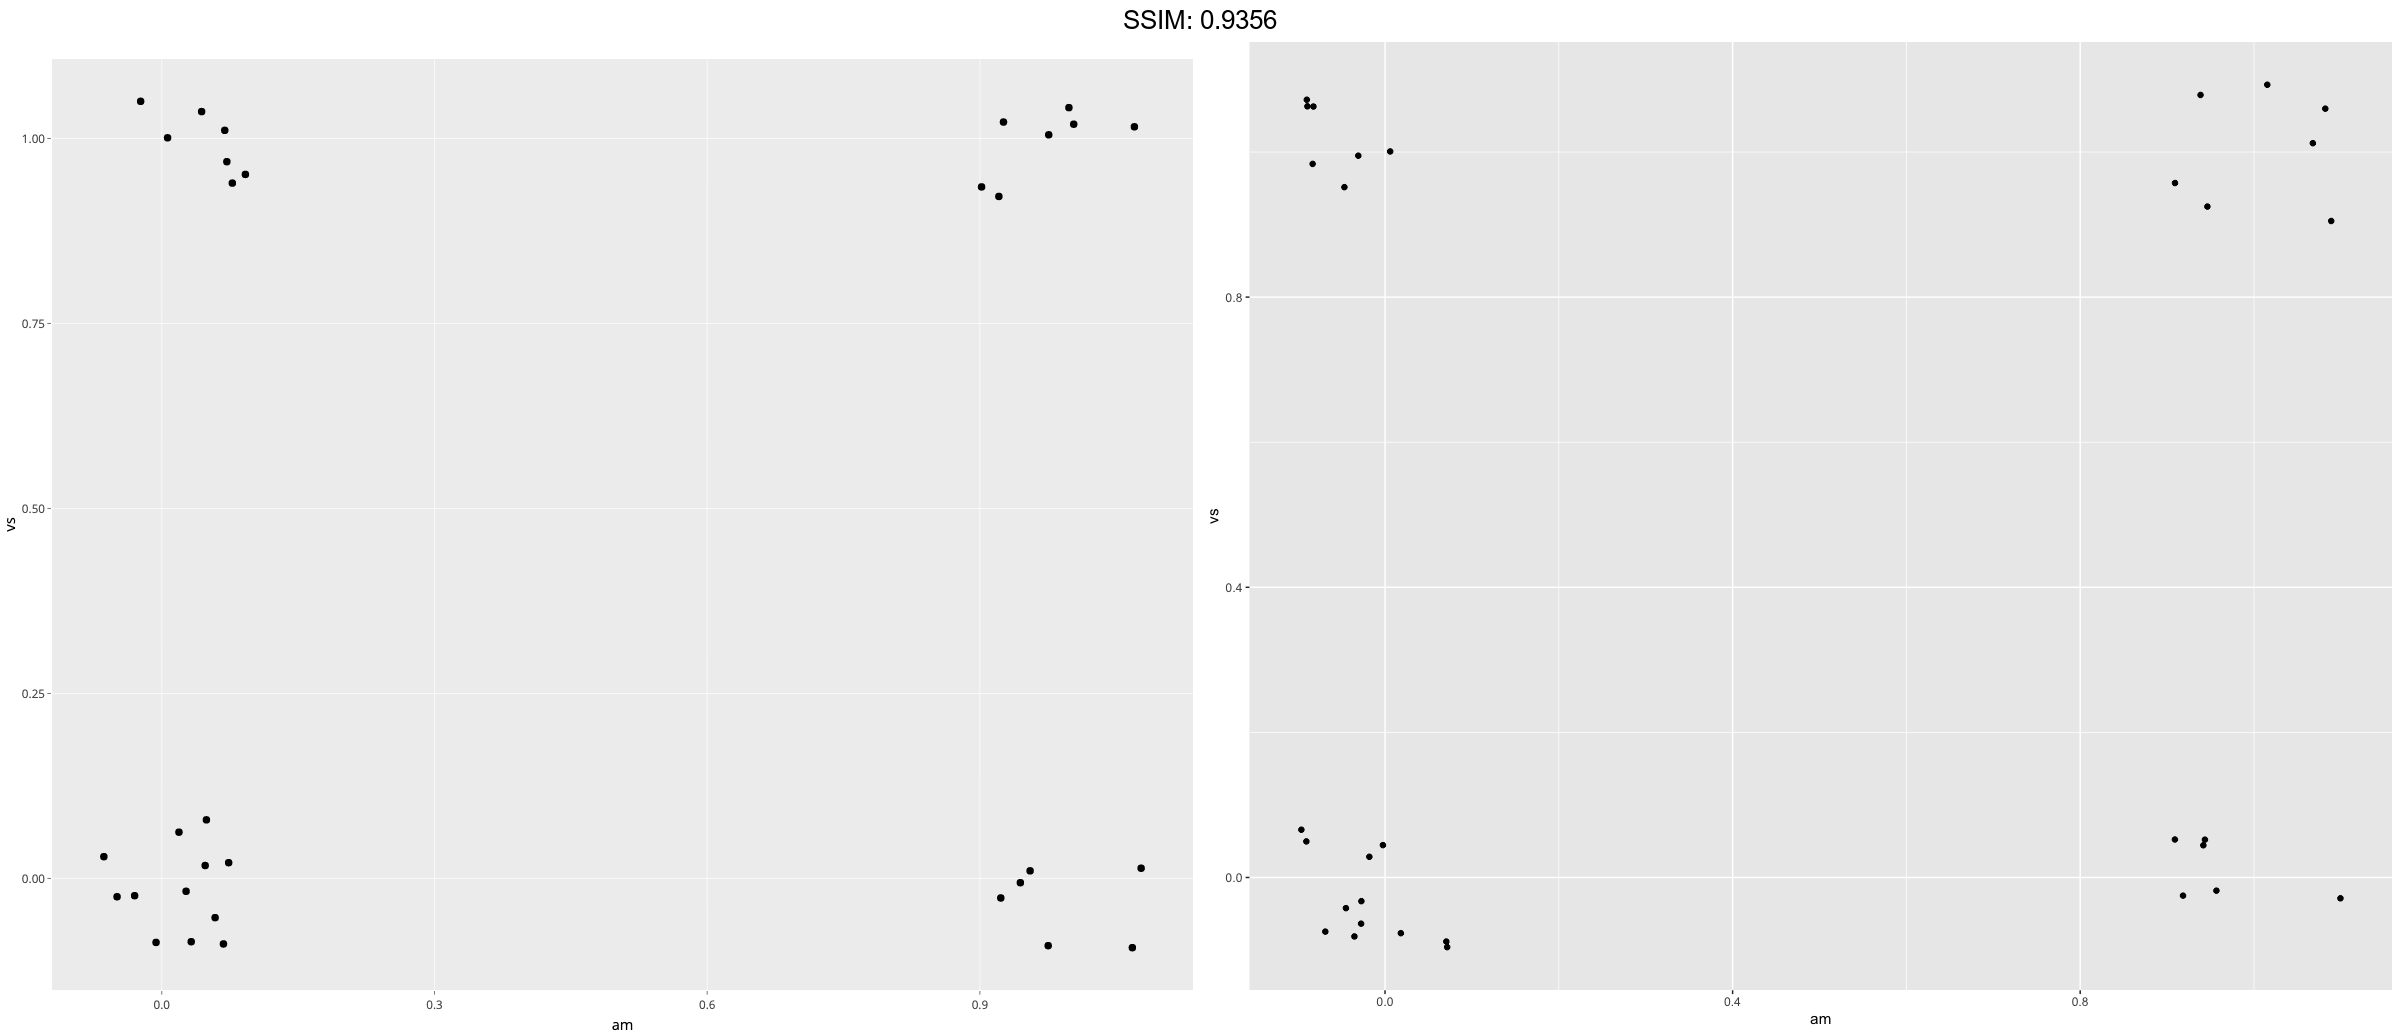
p <-
 ggplot(mtcars, aes(am, vs)) +
  geom_jitter()
plotly::ggplotly(p)
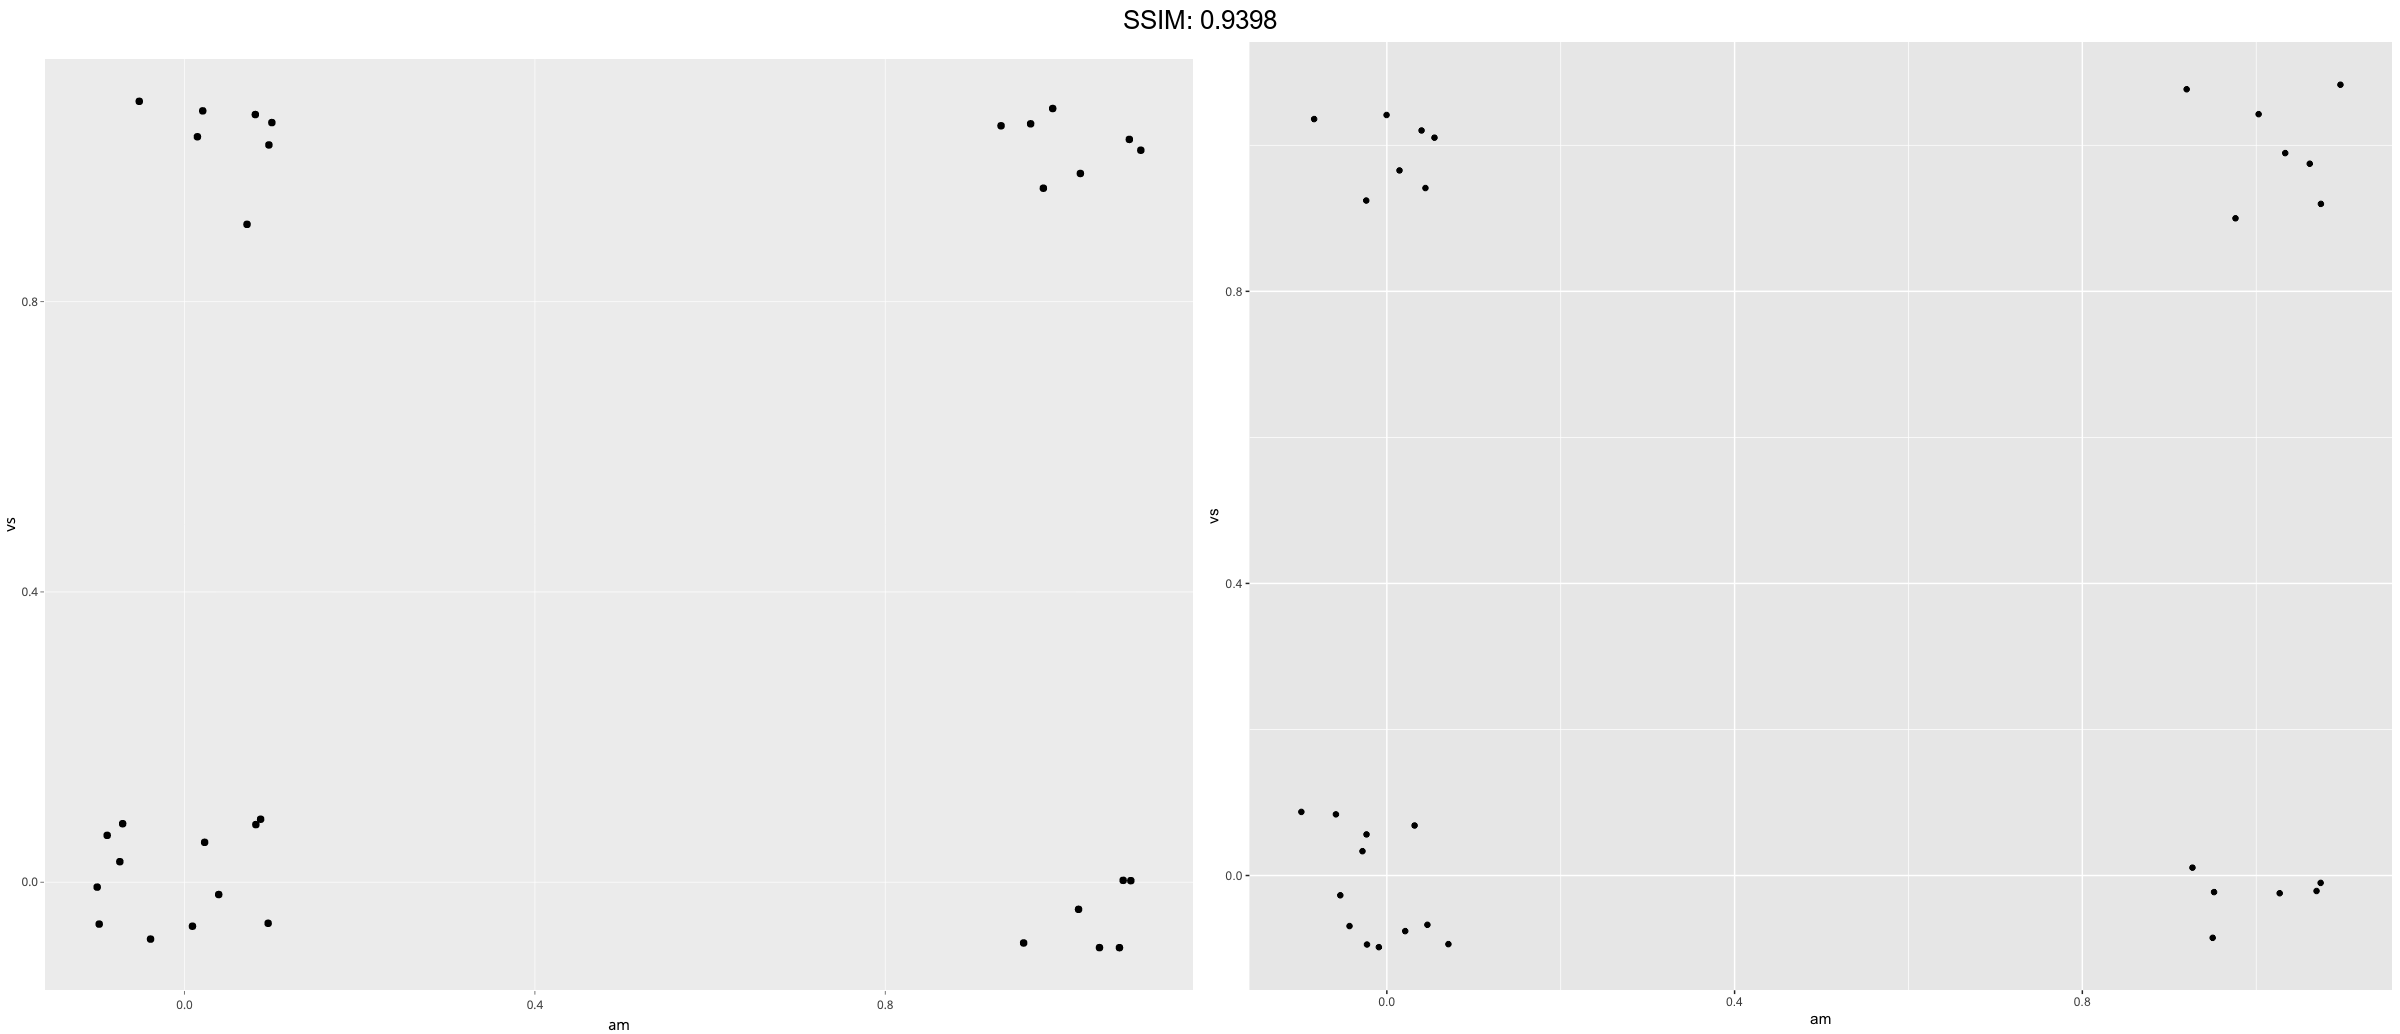
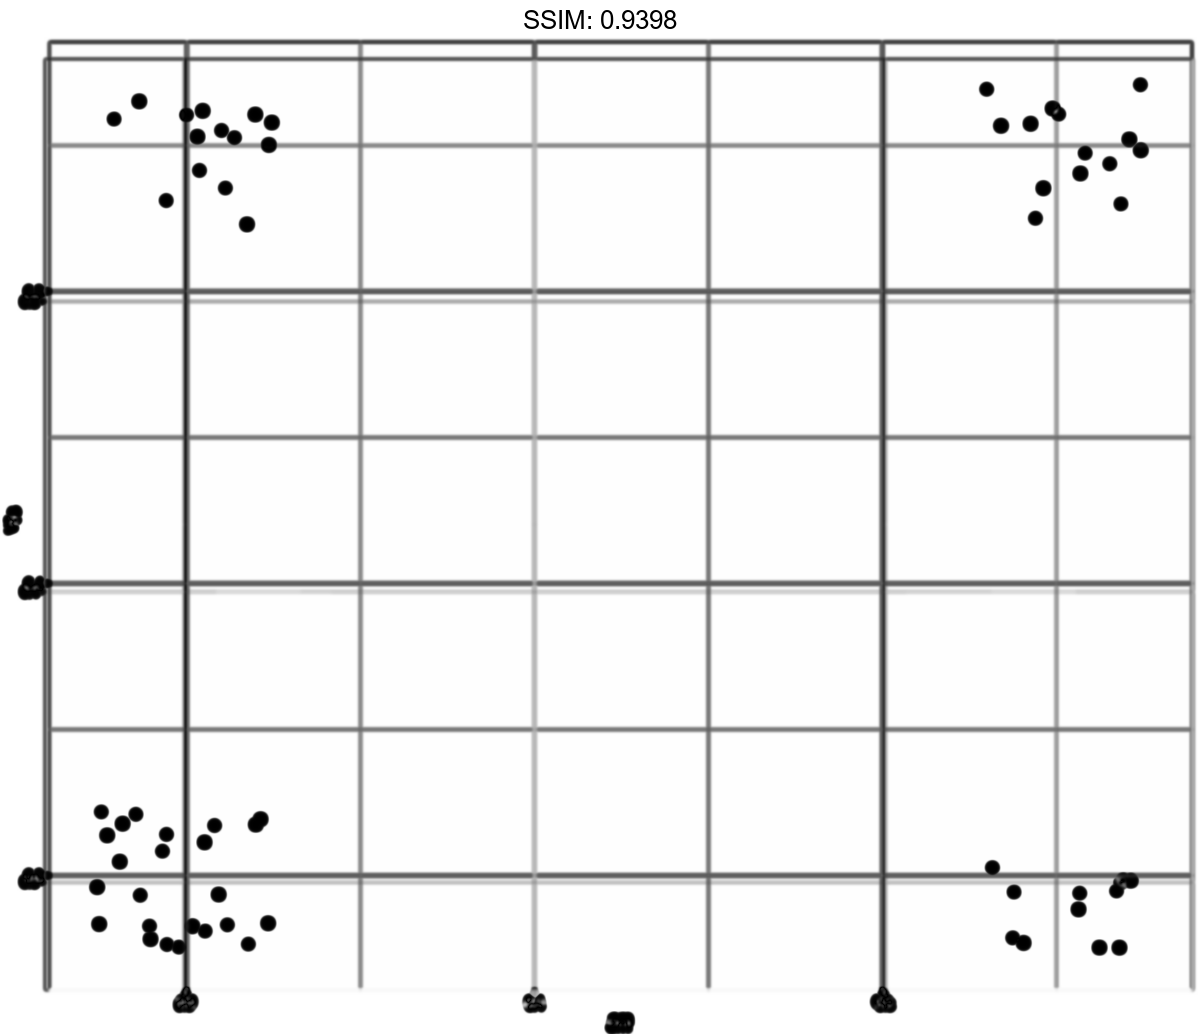
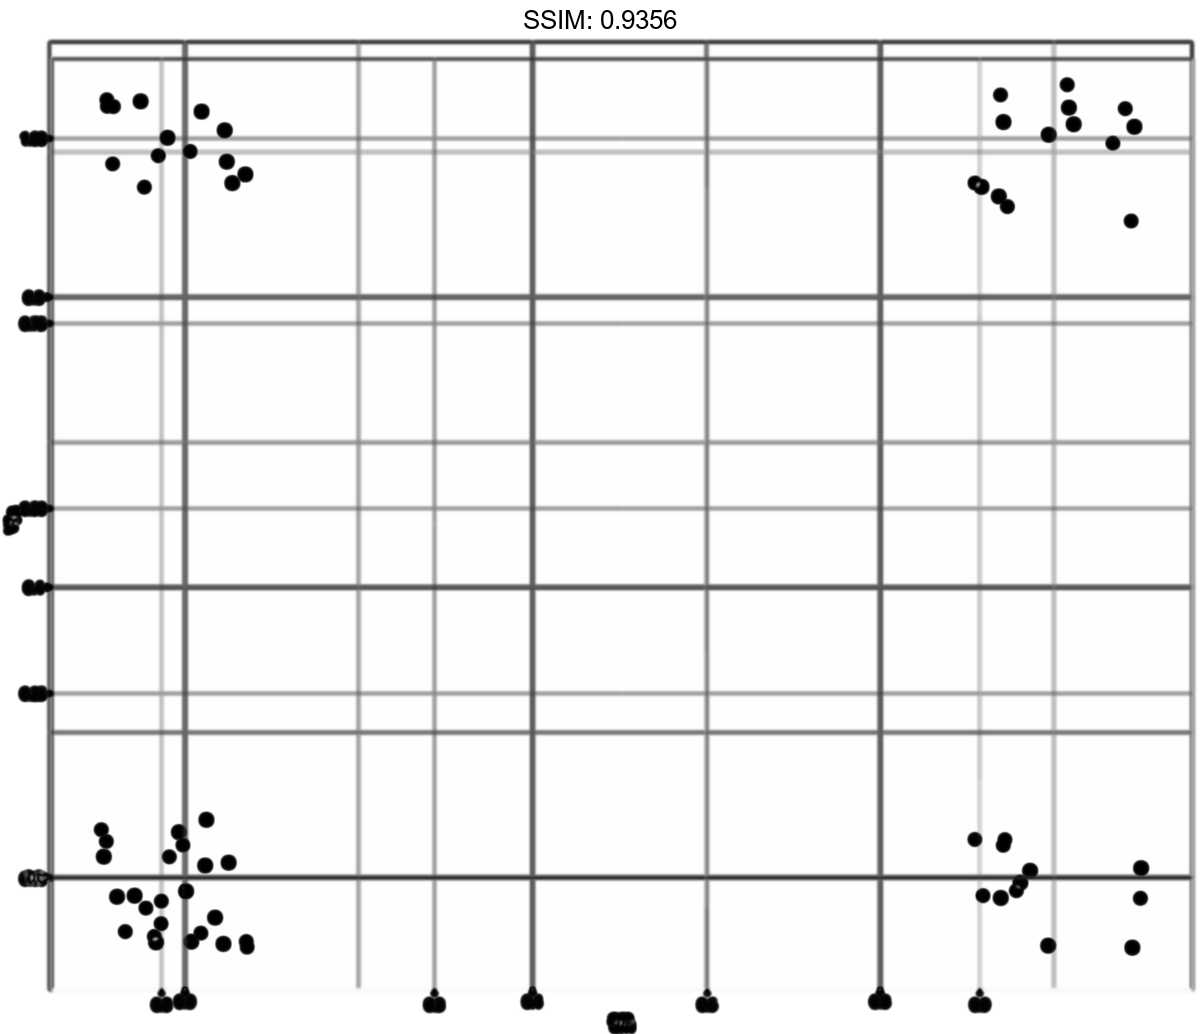
p <-
 ggplot(mtcars, aes(am, vs)) +
  geom_jitter(width = 0.1, height = 0.1)
plotly::ggplotly(p)
p <-
 ggplot(mtcars, aes(am, vs)) +
  geom_jitter(position = position_jitter(width = 0.1, height = 0.1))
plotly::ggplotly(p)
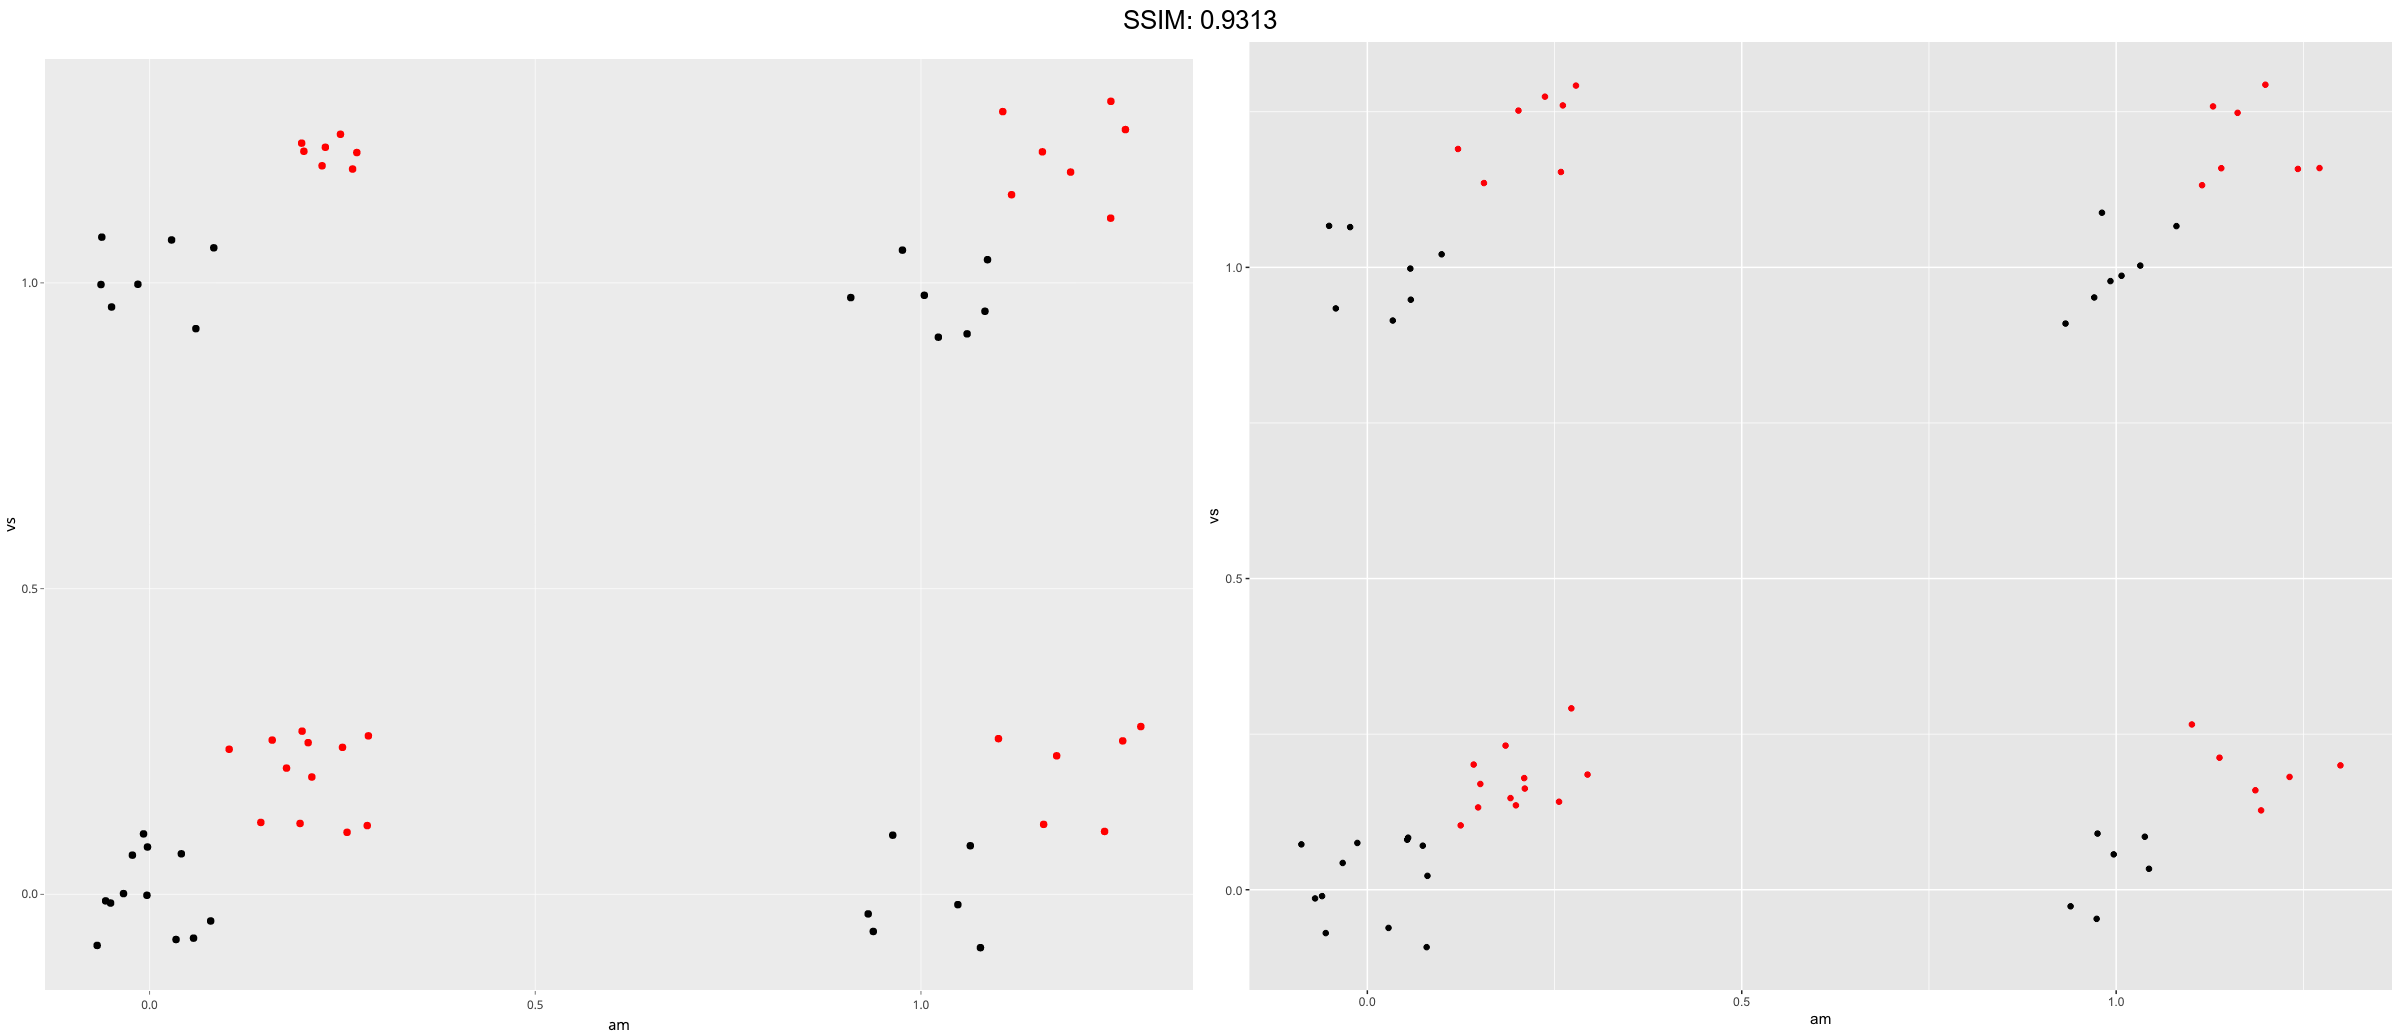
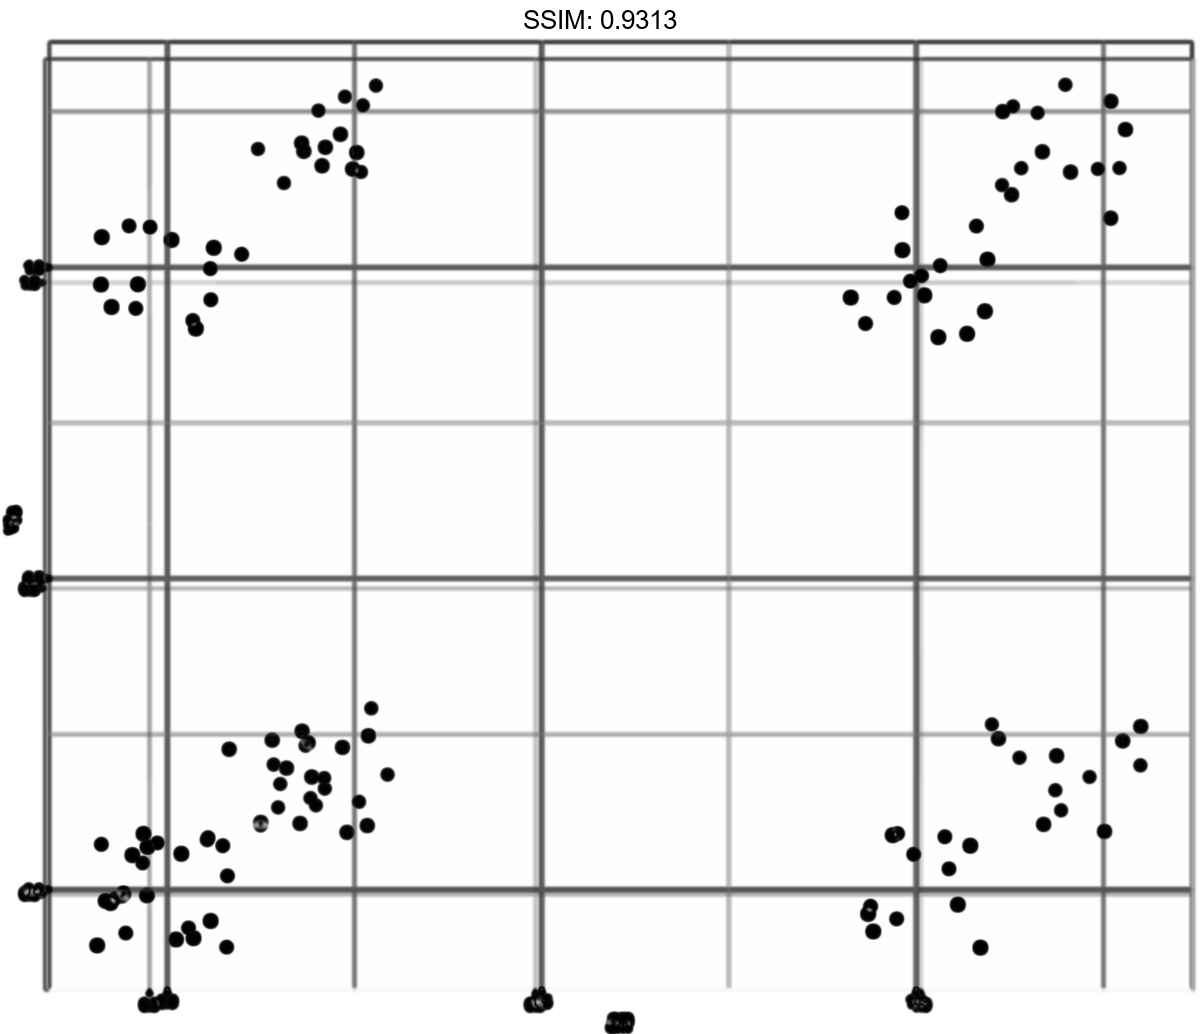
jitter <- position_jitter(width = 0.1, height = 0.1)
p <-
 ggplot(mtcars, aes(am, vs)) +
  geom_point(position = jitter) +
  geom_point(position = jitter, color = "red", aes(am + 0.2, vs + 0.2))
plotly::ggplotly(p)